Wednesday, November 7, 2012

Inquiry with Kim!

When I was taking my Bachelor of Education, I was right into the whole idea of integration.  Integrate everything possible into LANGUAGE!  Because at that time, language was the main (and seemingly only) focus.

Now that I've had the chance to get comfortable in both Math and Language, I have seen the opportunities to blend them.  But beyond that, I want to integrate more, like science, and social studies, and arts.  Rather than having "math" and then "language" and then "science," why not just have "learning" blocks?  I know, I know, I've blabbered about this in a previous post - but allow me to digress.

Today, I was fortunate enough to have a member of our Program Resource Team in to do an inquiry.  Kim Machan, who I taught alongside in my first year of teaching (for a month, and I really had no idea what I was doing) came in and we presented a number of challenges to my class, wrapped up in a neat, two hour learning block.  I'm thrilled with the results!  On the way into work, I told my fiancee (who, by the way, teaches across the hall from me and writes a French Teaching Blog over at http://confessionsofafrenchteacher.blogspot.ca - check it out, she's amazing!) ... anyway, I told her, "Steph, I'm really worried!  I think this whole experiment is going to be a bomb!  It's going to blow up and there'll be two hours where I have nothing else planned!"  Fortunately, the only explosions were positive.  I'll tell you about that when it's time, though.

I planned to use Science as my "theme" (if you will) for the day.  We'd explored two of the big ideas for the energy conservation strand, and I wanted to see how they would apply their current knowledge and understanding to discussions and real-world situations, as well as a math problem.  I designed the day to look like this, in a (nut-free) nutshell:

This group is working in one of the cozier spaces in the
classroom, with access to a chalkboard coffee table and
great seating ... it seemed to bring them into
a comfortable discussion!
1. Jigsaw Activity: Read the article with your group (Group A, B, C, D - four different articles) - become an "expert." This is not a new idea by any means.  I do not take credit for it!  I hadn't tried it with this group yet, so I was anxious about how they would approach it.
2. Jigsaw Activity: Split up and go into your new group (Group 1, 2, 3, 4) - teach the new group members about your article.  Discuss!
3. Rejoin your original group.  Discuss the ideas and ask a question that you could collect data for, and graph it.
4. Present and discuss the graphs.
5. Complete a survey online (via Google Docs).
6. Graph the results.

Well, I overshot, but I knew I had in planning it.  I just wasn't sure how much discussion would really happen, and wanted to make sure I had no "dead air time" when I had someone in to help me observe the thinking of the kids.  I wanted to make the absolute most of it, which I did - without getting to steps 5 and 6.

This group is going over the article to make sense of it.
They chose to work at a round table so that they could hear each other better.
What really ended up happening was that the initial reading and discussing lasted for about an hour!  My mind was blown.  When they shared, we really saw some gaps and some successes.  This is when Kim suggested that we see what questions they had by asking them to take a solid 10 minute break to just digest and record their thoughts and wonders.  It was a perfect idea.  We learned a lot from their writing: some were way off, and asked random questions unrelated to the articles; some had questions that showed that they realized they didn't quite "get" the articles and that they needed to fix that; some asked questions to extend their current (solid) understanding of the articles; some made great observations and shot for the stars.  It was very eye opening, and really a simple (and almost obvious) next step, yet I somehow missed it in the chaos of being the teacher.  This is why I value bringing in outside eyes - they see what I easily miss, and I have no problem with that!

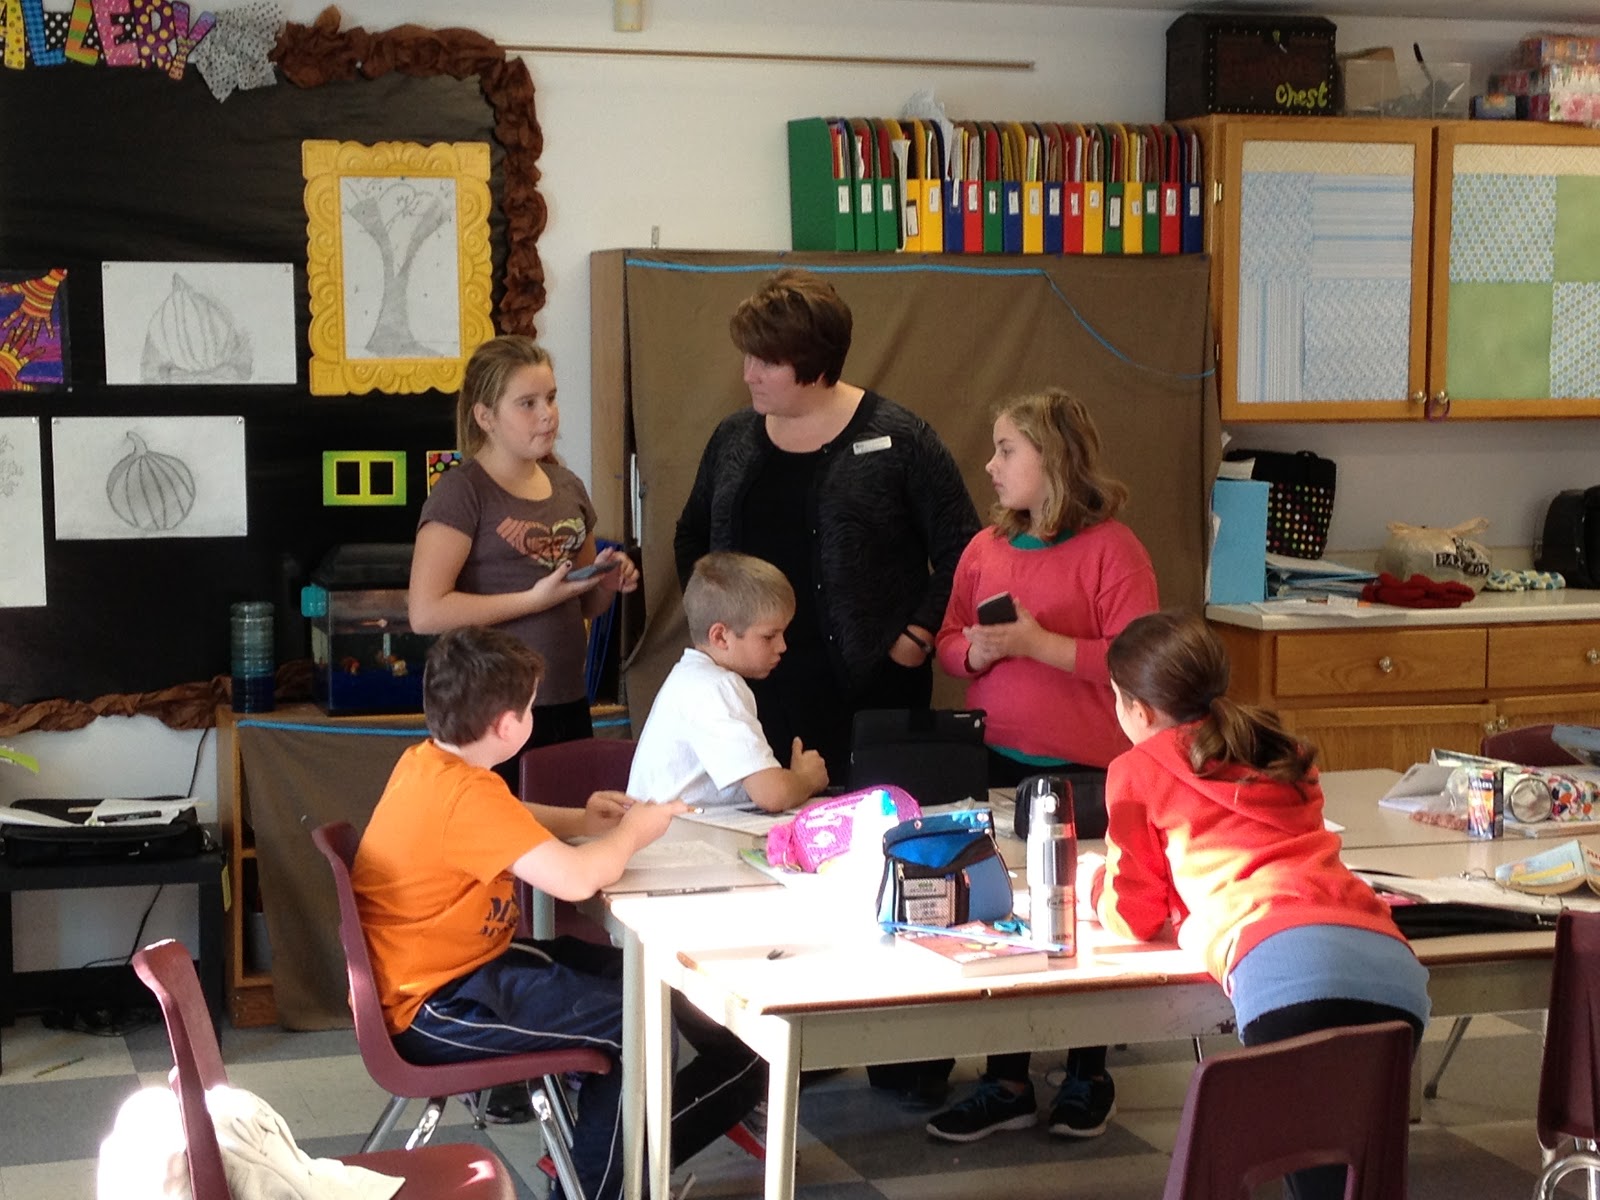
Kim Machan engages some interesting thinking from
the kids in this group.  They were talking about solar panels
and used a calculator to show her how sand on the panels
could be an issue.
With the language portion complete, it was time to get mathy.  The prompt was simple: think about what you read or heard about, and ask a question that you could collect data about, and display using an appropriate graph.  From BIG ideas (Shoes that make electricity, walls that are gardens and clean the air, art that produces energy ...) they came up with really interesting questions: What brand of shoe would people buy, if they bought the in-shoe-technology? Over the history of the world, how has electricity use grown? (This one is awesome, and a little cute - it's such a LARGE question that they'll soon realize that they'll need a few years to find their answers, but in keeping with the problem based approach, all of the adults in the room - at this point it was myself, Kim and our awesome LRC Mrs. Sutherland - let it go, so that their thinking could just bounce around.)  The kids found the data that they could, graphed it out using a solid graphing skillset (whoa - don't read that as "they're perfect," I just meant for where we are, they're doing great!!) and in the end, shared their work with the class, asked questions about each others work, and answered the questions as best as they could.

This group read about harnessing the wind to
air condition, using an ancient approach that is
better for the environment.  They were so intrigued
that they went online to find out
more - because they want to build them at home!
I could go on forever, but I won't.  The main idea here is that these kids were presented with ONE "learning spine" - that's the term I'll use to describe what held everything together.  Yes, they were reading, decoding, strategizing to infer and make meaning of words and sentences and the text as a whole.  Yes, they were graphing, working with numbers and thinking critically.  Yes, they were learning about energy use, energy conservation and what's happening in the real world around energy.  They were working on their social skills, their ability to communicate with others and their abilities to reflect on their own work and thinking.  When we debriefed after the learning block, Kim and I realized that we had touched on every single mathematical process skill in the curriculum.  Is it because I'm a planning genius?  NO!  To be honest, I didn't even look at that part of the curriculum when I was planning for the learning block.  But I've been building the kids up to be able to work like this, and as a result, their process skills are naturally progressing.  I put in the time before - I didn't expect miracles today.

They did a fantastic job for a first Jigsaw activity.  Kim commented that it seemed to be "business as usual" - now that's a great compliment, because it shows that they weren't putting on a show for someone new in the room.  In fact, I don't think they really noticed, other than the fact that there was someone else to bounce ideas around with.

So this post isn't super mathy ... but that's the point, isn't it?  My students were THINKING today - it tied into math, but it also tied in everywhere else.  To borrow an overused term, we got out of the silo and I think we really got to play in the barnyard today.  It was planned, but still flexible.  It was neat, but dirty!  We inquired together as students, as teachers, and as one learning community.  Isn't that what it's all about?  It was more than integration - it was learning.  Plain and simple.

Tuesday, November 6, 2012

My Great Moment

Today I had a great moment.

We've been working away on Data Management and the focus has really been on selecting the most appropriate graph to display data.  We've spent a great deal of our focused "instructional" time looking at the differences between bar graphs and line graphs - that you can't really effectively graph what the class's favourite type of pizza is on a line graph, but you can graph how many slices of pizza are eaten over the course of a month by the class.  It's all about time comparisons versus quantity comparisons.  For some reason, as educators, we often forget to go that extra step of looking into something other than a bar graph for favourites.  It's my pet peeve.  For goodness sake, there's more to data management than surveying whether people like rain or don't like rain!

The other day, I gave the kids a graph with only the data on it.  No labels, no numbers, no title.  Their job was to list out possibilities for what the data was representing, and then to select the best option and complete the graph so that it suited their idea.  I thought this wasn't asking too much.  But, apparently it was.  Although we'd worked forward - building the graph - working backward was apparently very difficult.  It really begs the question - are we over marking our students in data management by expecting the bare minimum?  It would explain why at multiple schools, the data management strands are often low on the EQAO results.  This experience prompted me to explicitly teach that line graphs were about timelines, since the graph I showed them was a line graph, and yet many students were suggesting that the graph might be about people's favourite fill-in-the-blank.  UGH!

So, today we kicked things off with a review/consolidation on graphs of all sorts.  I made it EXPLICITLY CLEAR, and re-asked the same question I'd asked last week:

Ask a question about your environment (it could be fact based or opinion based). Get creative! Find the data, and select the most appropriate graph to display your results.  Be sure to make thick and thin observations.

(Thin = right there; for example, on Monday, the temperature is 2 degrees celsius.
Thick = think about it/do some work; for example, the temperature will drop by 5 degrees between Monday and Thursday.)

The kids are really getting into it: they're surveying the school to see who is wasting electricity by leaving lights on when they don't need them, who is throwing paper into the garbage can instead of the recycling bin, or who is leaving projectors on when they aren't using their Smart Boards.

But what really excited me - what really was a "great moment in teaching" - was when two boys who are quite intuitive with their math work and often speed through - approached me with the idea that they'd like to compare the use of lights over the course of the week - so they wouldn't be able to finish today, but would need the rest of the week.

BINGO!  This is what it's all about.  They're buying into it, and making their learning meaningful on their own.  They don't need me to do it for them anymore.  The fireworks went off!  I did my happy dance!  Two down, 19 to go!